 BULLSTAR
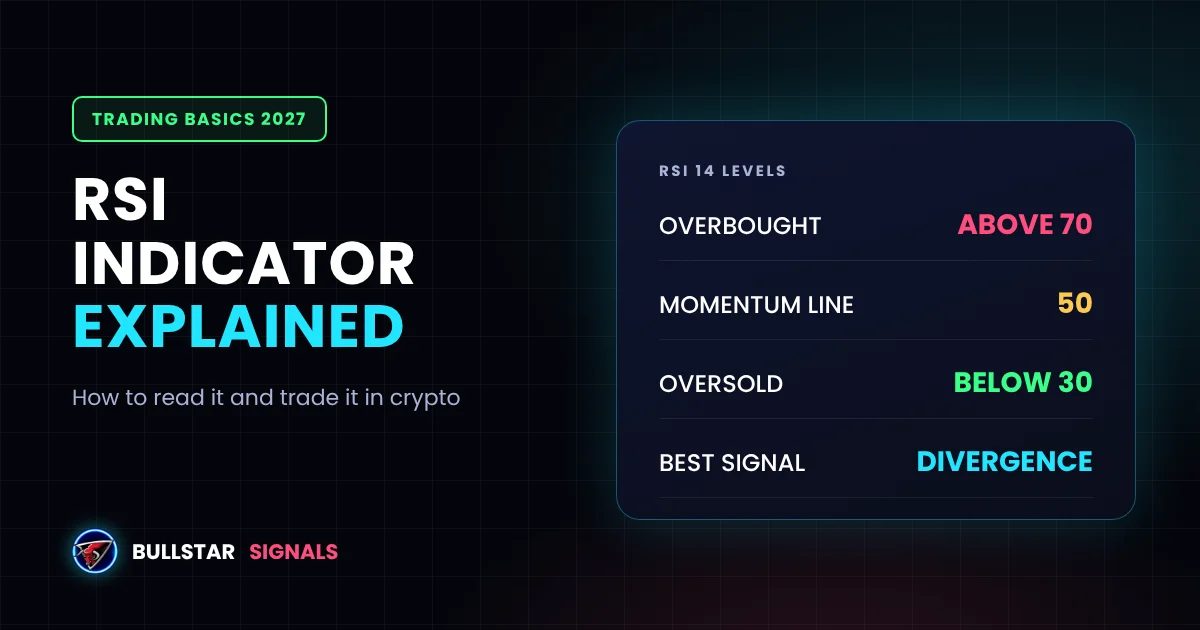
RSI is the indicator almost every crypto trader has on their chart, and the one most people use wrong. They see "overbought", they short, and the price keeps going up. They see "oversold", they buy, and it keeps falling.
Used properly, RSI is one of the most useful tools you have. This guide explains what RSI actually measures, how to read it, the best settings for crypto, and three practical ways to trade with it. There is a free RSI calculator below too.
- What it is: RSI (Relative Strength Index) measures how strong recent price moves are, on a scale from 0 to 100.
- How to read it: above 70 is overbought, below 30 is oversold, and 50 is the line between bullish and bearish momentum.
- Best setting: the default RSI 14 works for most crypto traders on the 1H, 4H and daily charts.
- Biggest mistake: selling just because RSI is above 70. In strong trends RSI can stay overbought for weeks.
What Is the RSI Indicator?
The Relative Strength Index was created by J. Welles Wilder in 1978. It is a momentum indicator: it does not tell you where price is, it tells you how hard price has been moving in one direction.
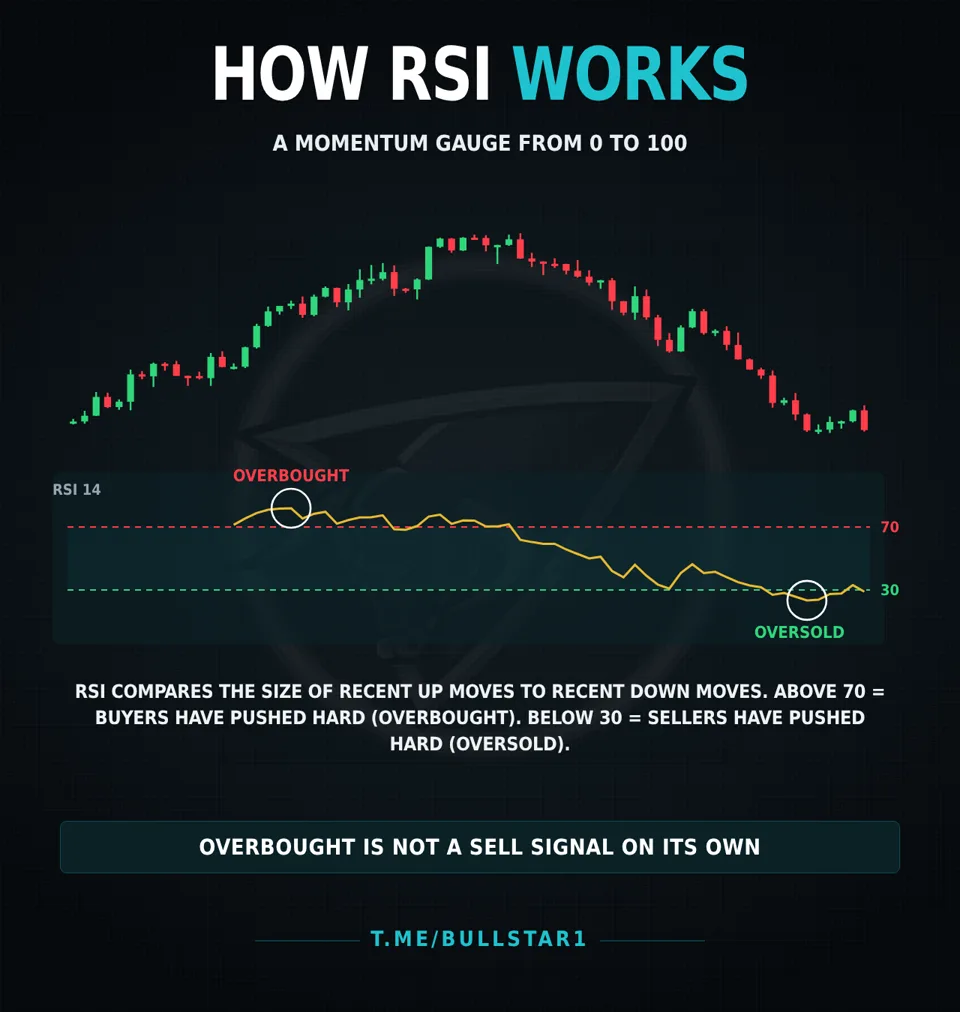
RSI looks at the last 14 candles (by default) and compares the average size of the up moves with the average size of the down moves. If most of the recent movement was up, RSI is high. If most of it was down, RSI is low. The result is always a number between 0 and 100, shown as a line under your chart.
The formula, if you are curious:
RSI = 100 - 100 / (1 + RS), where RS = average gain / average loss over the period.
You never need to calculate it by hand. TradingView, Binance and every other charting platform draw it for you. But knowing what goes into it explains how it behaves.
How to Read RSI: 70, 30 and 50
| RSI reading | What it means | What it does not mean |
|---|---|---|
| Above 70 | Buyers pushed hard, price is stretched | Price must fall now |
| 50 - 70 | Bullish momentum | A safe long |
| 30 - 50 | Bearish momentum | A safe short |
| Below 30 | Sellers pushed hard, price is stretched | Price must bounce now |
The 70 and 30 levels are the famous ones, but the 50 line is just as useful. In a healthy uptrend, RSI tends to stay above 50 and bounce off the 40-50 area on pullbacks. In a downtrend, it tends to stay below 50 and get rejected around 50-60. A cross of the 50 line is often an early sign that momentum is changing.
Free RSI Calculator
Paste closing prices (one per candle, oldest first) and the calculator works out the RSI the same way charting platforms do. You can copy the closes from any chart or exchange.
The Overbought Trap: Why RSI 70 Is Not a Sell Signal
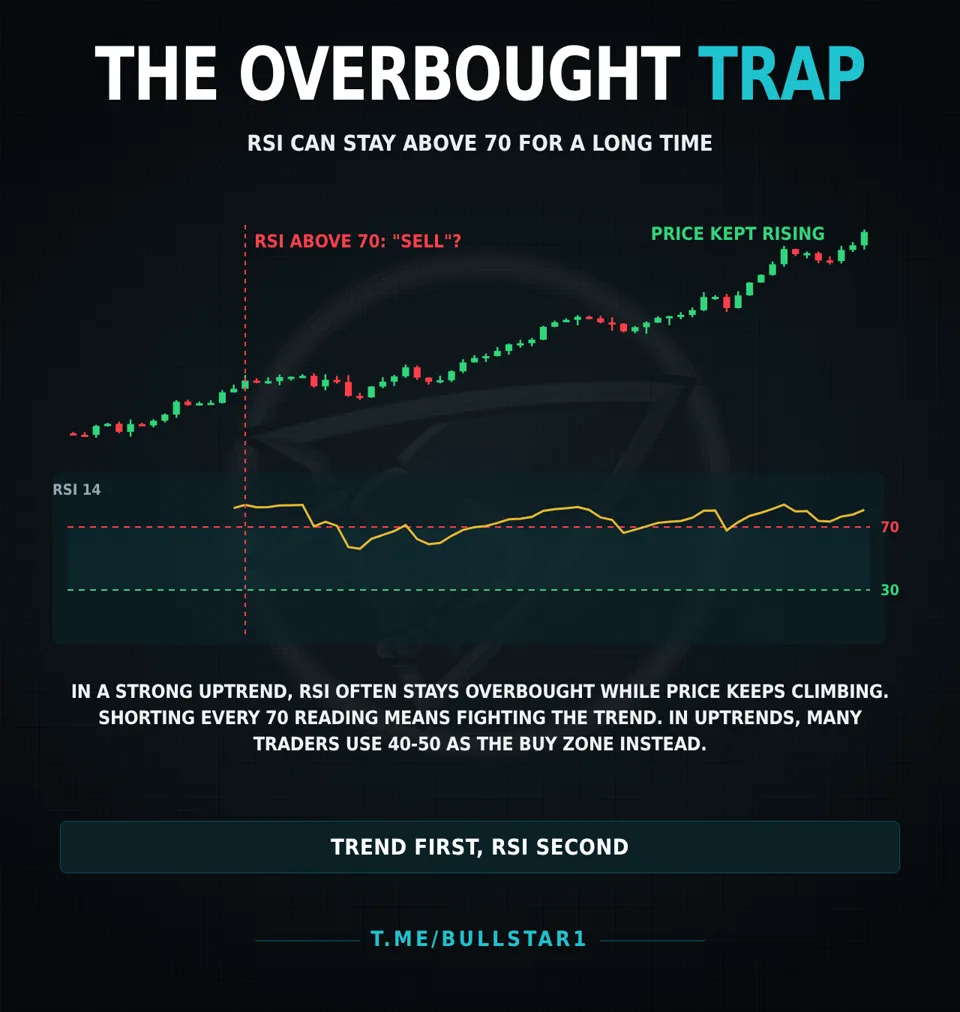
This is where most beginners lose money with RSI. A reading above 70 means buyers have been very strong. In a strong trend, that strength can continue for a long time. Bitcoin has spent whole weeks with the daily RSI above 70 during bull runs, and every short taken "because RSI is overbought" got stopped out.
The same is true the other way. In a crash, RSI can sit below 30 while price keeps falling, and "it's oversold, it has to bounce" becomes a very expensive thought.
The fix is simple: trend first, RSI second. Look at the trend on a higher time frame before you look at RSI. In an uptrend, use RSI to find pullbacks to buy, not tops to short. In a downtrend, use it to find rallies to sell, not bottoms to catch. Our guide on the best time frame for crypto trading shows how to check the higher time frame trend.
RSI Divergence: The Most Useful RSI Signal
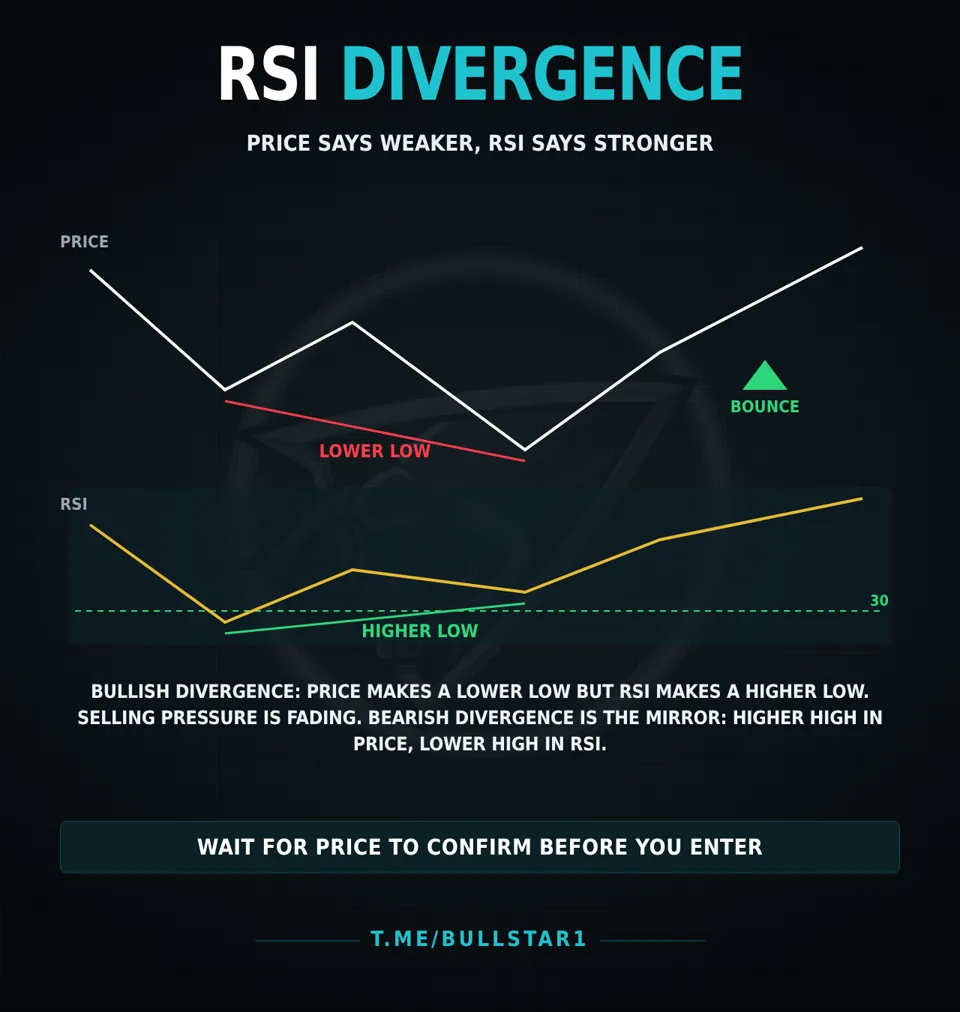
Divergence happens when price and RSI disagree. It is the RSI signal many experienced traders rely on most, because it shows momentum fading before price turns.
- Bullish divergence: price makes a lower low, but RSI makes a higher low. Sellers pushed price lower, but with less force than before. A bounce or reversal often follows.
- Bearish divergence: price makes a higher high, but RSI makes a lower high. Buyers are still pushing, but they are running out of strength.
Two rules make divergence much more reliable:
- Use it at a key level. A bullish divergence at a strong support level or a Fibonacci zone is worth far more than one in the middle of nowhere.
- Wait for confirmation. Divergence can keep building for several candles. Wait for price to react: a strong candle, a break of a small trendline, or a reversal pattern.
3 Practical RSI Strategies for Crypto
1. Buy the pullback in an uptrend
The daily trend is up. On the 4H chart, wait for price to pull back until RSI drops to the 40-50 area, near support. Enter when RSI turns back up and price prints a bullish candle. Put your stop loss below the support level. This keeps you trading with the trend instead of against it.
2. Divergence at a key level
Price drops into a strong support zone and makes a lower low, while RSI makes a higher low. Wait for a bullish candle to close back above the low, then enter with a stop below the new low. Target the next resistance level. Reverse everything for a bearish divergence at resistance.
3. The 50-line momentum shift
After a long downtrend, watch for RSI to break above 50 and then hold above it on the next pullback. That shift often comes before a trend change on the chart. It is a slow signal, so it works best on the 4H and daily charts and combined with a break of resistance.
Whatever strategy you use, always size the trade so the stop loss costs only 1-2% of your account. Our position size calculator does the math.
Best RSI Settings for Crypto
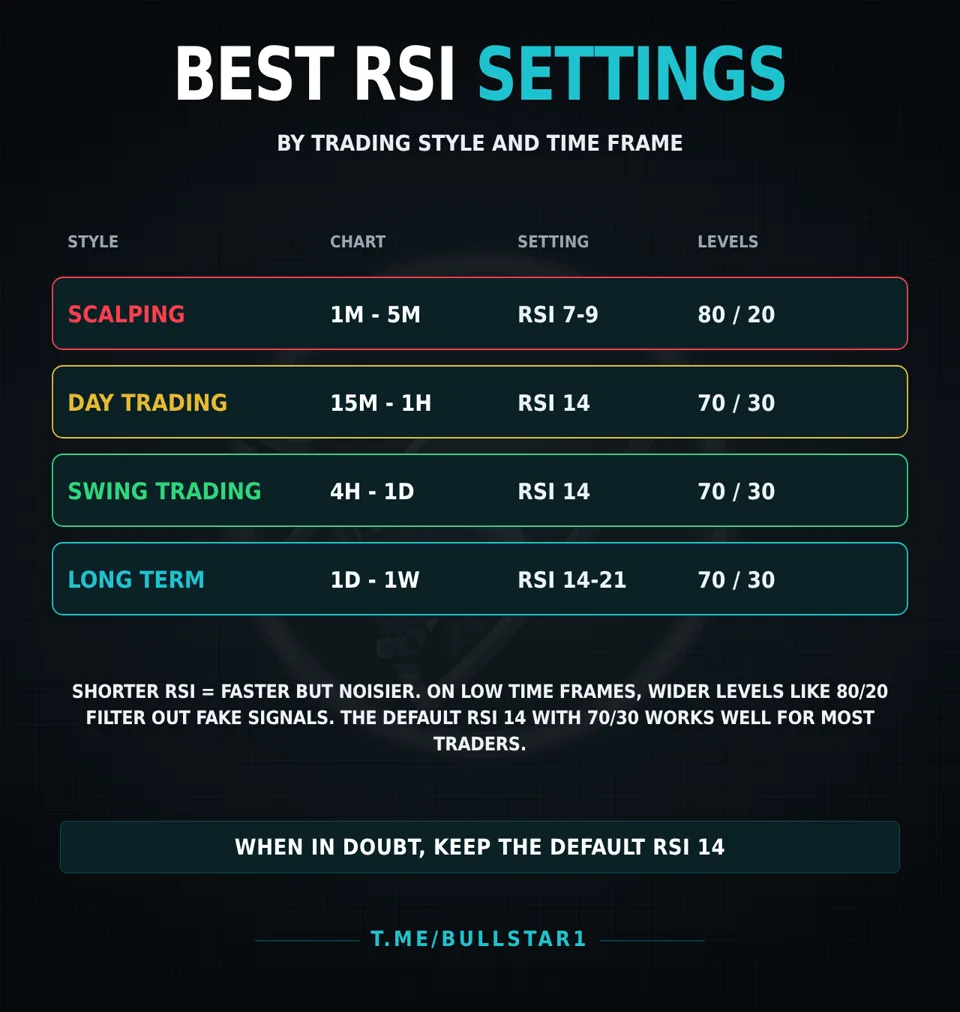
The default RSI 14 with 70/30 levels is the standard for a reason: it works on most charts and it is what most traders watch, which makes those levels more meaningful.
- Shorter period (7-9): faster, reacts to small moves, but gives many more false signals. Mostly for scalping on 1m-5m charts, often with wider 80/20 levels.
- Default (14): the best balance for day trading and swing trading on 15m to daily charts.
- Longer period (21): smoother and slower, useful on daily and weekly charts for the bigger picture.
Changing settings rarely fixes a strategy. If RSI keeps giving you bad signals, the problem is usually trading against the trend, not the number 14.
Common RSI Mistakes
- Shorting every overbought reading. In a strong trend this is the fastest way to collect losses.
- Using RSI alone. RSI works best with structure: support, resistance, trendlines and patterns.
- Trading divergence without confirmation. A divergence can keep growing while price keeps moving the wrong way.
- Using RSI on very low time frames. On the 1m chart RSI flips between overbought and oversold all day.
- Constantly changing settings. Pick one setting, learn how it behaves, and stick with it.
- No stop loss. RSI tells you about momentum, not where you are wrong. Your stop loss still goes at a level on the chart.
RSI and Trading Signals
RSI is one of several tools we use when we plan a signal, together with market structure, support and resistance, volume and the higher time frame trend. No single indicator is enough on its own, which is why every Bullstar signal comes with a clear entry zone, take-profit targets and a stop loss.
You can see how every VIP signal since 2022 played out, losses included, on our results page, or follow the free Telegram channel to watch the setups live.
Not financial advice. Crypto trading, especially with leverage, carries high risk.