 BULLSTAR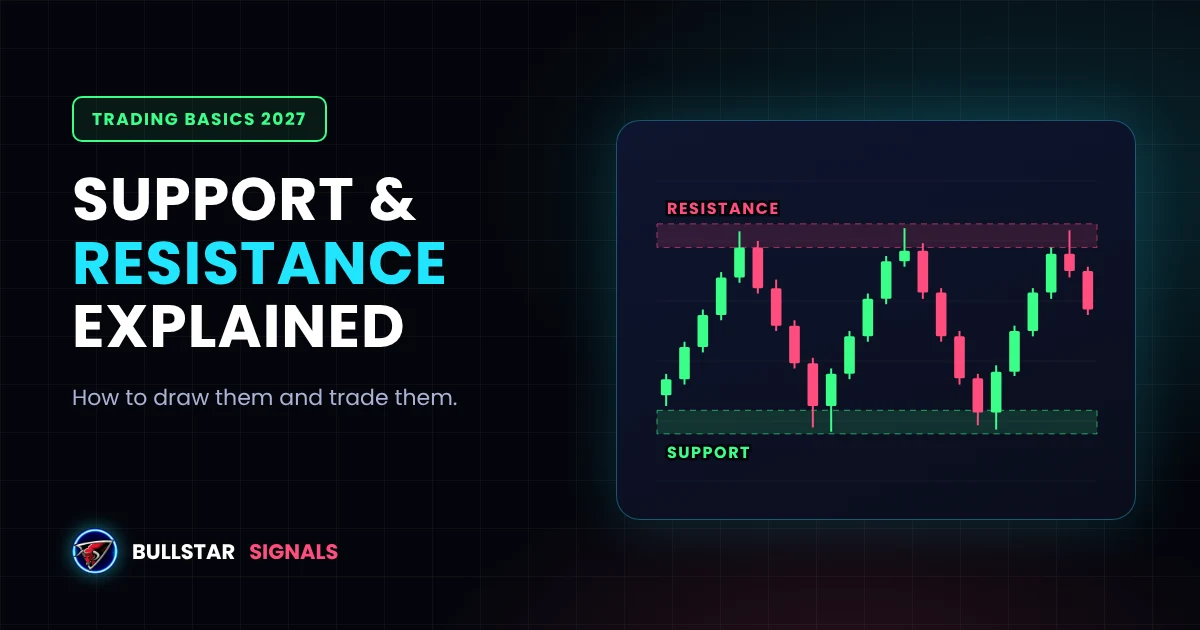
Support and resistance are the first thing most traders draw on a chart, and for good reason. They show where buyers and sellers have stepped in before, which tells you where to enter, where to put your stop loss and where to take profit. If you understand just one concept in technical analysis, make it this one.
This guide explains what support and resistance are, why they work in crypto, how to draw them properly, and how to turn them into a complete trade plan. There's also a free risk/reward checker you can use on your next setup.
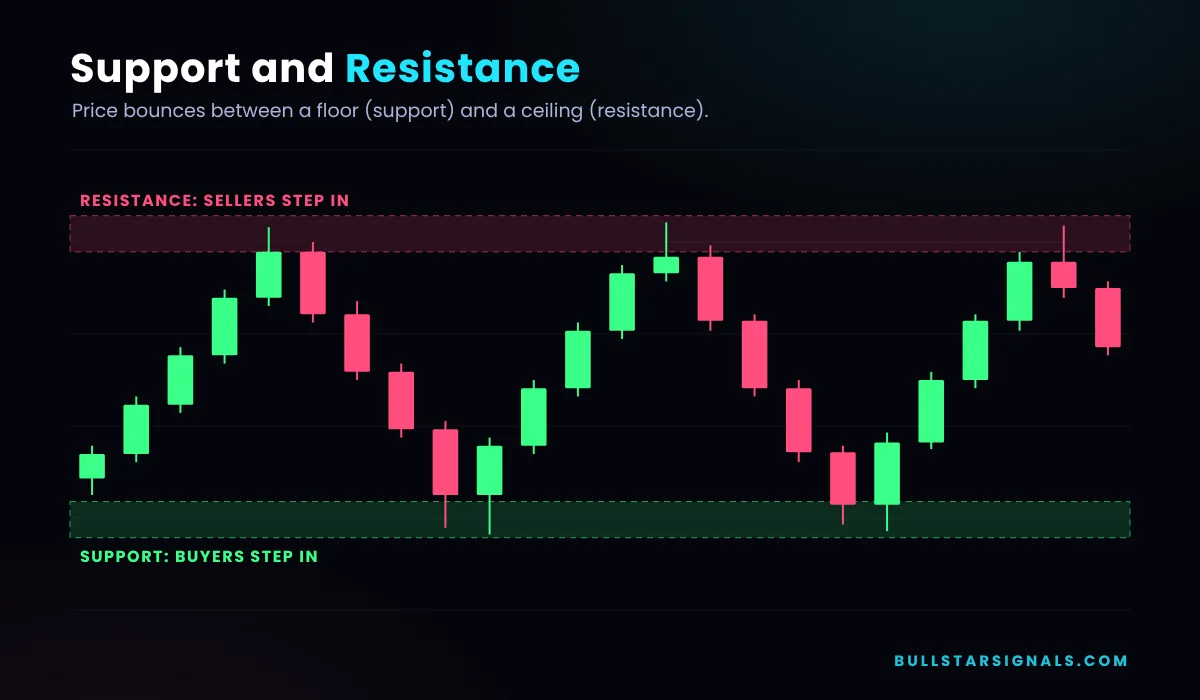
Support is a price zone where buying pressure tends to stop a fall. Resistance is a price zone where selling pressure tends to stop a rise. Traders buy near support, take profit near resistance, and place stop losses just beyond these zones.
What Is Support and Resistance?
Think of support as a floor and resistance as a ceiling. When price falls toward support, buyers see good value and start buying, so the fall slows down and often reverses. When price rises toward resistance, sellers take profit or open shorts, so the rise slows down and often turns back.
| Support | Resistance | |
|---|---|---|
| What it is | A price zone where buying tends to stop a fall | A price zone where selling tends to stop a rise |
| Where it sits | Below the current price | Above the current price |
| Who is in control there | Buyers | Sellers |
| What traders do there | Look for long entries, place stops below it | Take profit, look for shorts, place stops above it |
| When it breaks | Often turns into resistance | Often turns into support |
Why Support and Resistance Work in Crypto
Support and resistance aren't magic. They work because of how people trade:
- Memory. Traders remember where price turned before. If Bitcoin bounced hard from a level last month, many will buy there again.
- Orders cluster. Limit orders, stop losses and take-profit orders pile up around obvious levels, so price often reacts when it reaches them.
- Regret. Traders who missed the last bounce wait to buy at the same price. Traders stuck in a losing trade wait to sell at break-even when price returns.
- Everyone sees the same chart. Crypto is traded around the clock by millions of people looking at the same obvious highs, lows and round numbers.
Because it's all about people, no level is guaranteed. Support can break and resistance can give way. That's exactly why every trade at these levels needs a stop loss.
How to Draw Support and Resistance Levels
Drawing good levels is simpler than it looks. Follow these steps:
- Start on a higher time frame. Open the daily or 4-hour chart first. Levels there matter more than levels on the 5-minute chart.
- Find clear turning points. Look for places where price turned at least twice: previous swing highs and lows, the edges of a range, and round numbers like $100,000 or $2.00.
- Draw a zone, not a line. Cover the wicks and the candle bodies of those turning points with a rectangle.
- Keep only the strongest zones. Two to four clear zones are enough. More than that and every price looks like a level.
- Zoom in to plan the trade. Use the 1-hour or 15-minute chart to time your entry inside the zone.
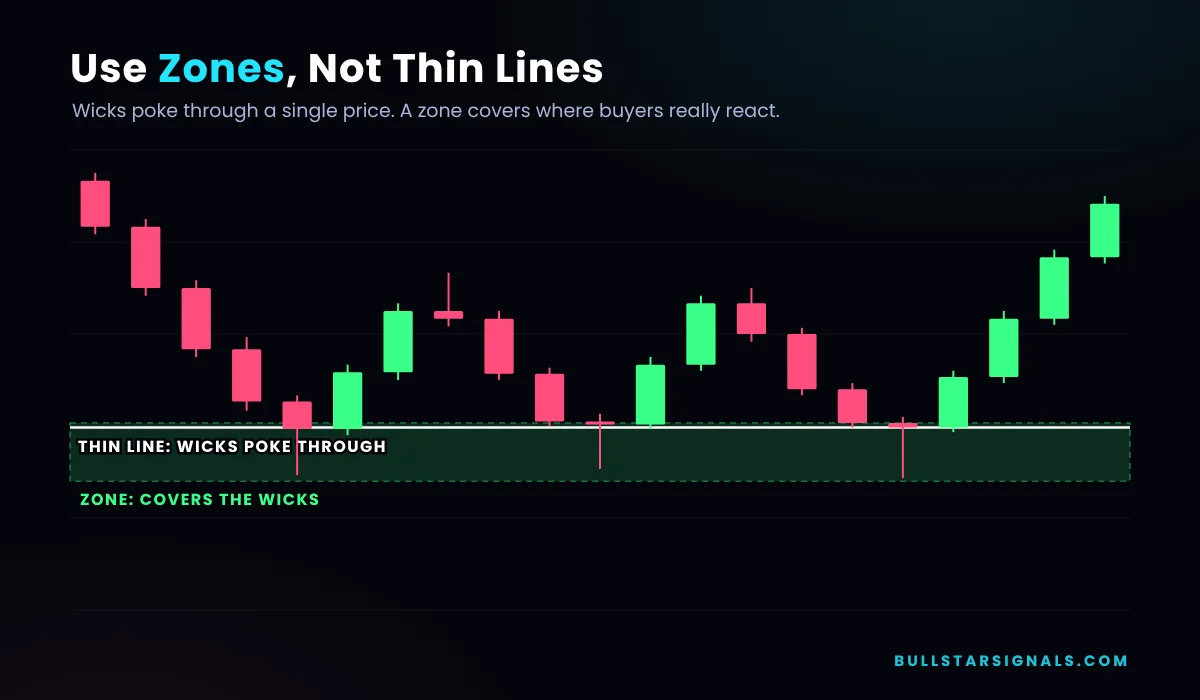
Why a zone? Because price almost never turns at one exact price. Wicks poke through, spreads move, and different exchanges show slightly different highs and lows. A zone gives you a realistic area to work with, and a clear place to put your stop loss beyond it.
How to Tell If a Level Is Strong
Not every level is worth trading. These signs help you judge how much a zone matters:
| Sign | Stronger level | Weaker level |
|---|---|---|
| Time frame | Daily or 4-hour chart | 1-minute or 5-minute chart |
| Number of reactions | 2 to 3 clear bounces | Only one touch, or so many touches it keeps getting chipped away |
| How price leaves | Fast, strong move away from the zone | Slow drift with lots of overlap |
| Volume | Higher volume at the reaction | Low volume, no clear interest |
| Age | Recent and still respected | Old level nobody reacts to anymore |
| Round numbers | Near levels like $100,000 or $2.00 | Random price with no history |
A strong reaction is one of the best clues. When price leaves a zone fast, with big candles and little overlap, it shows real buyers or sellers were waiting there. We show this with real examples in our crypto chart patterns guide, where we compare weak, standard and strong supply zones.
Role Reversal: When Resistance Becomes Support
One of the most useful ideas in trading is role reversal. When price breaks above resistance and stays above it, that old ceiling often becomes the new floor. The traders who sold there now want to buy back, and the traders who missed the breakout want to get in on the pullback.
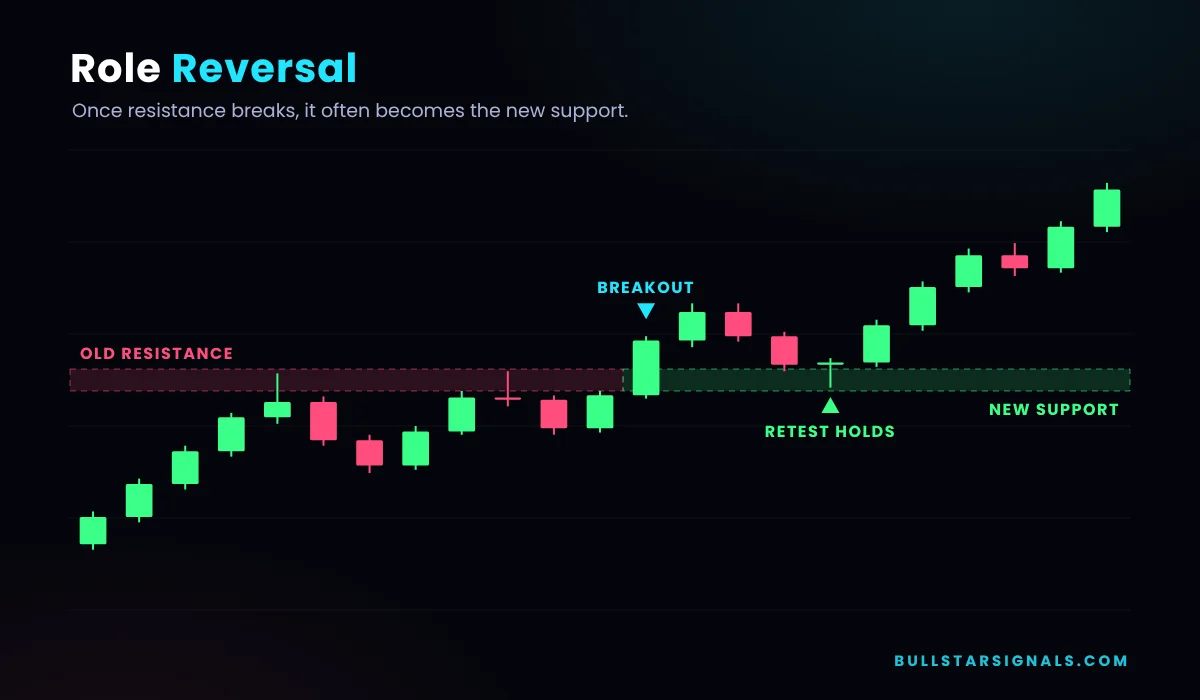
The same works the other way. When support breaks, it often turns into resistance. Price frequently comes back to "retest" the broken level from below before continuing lower. That retest is often a cleaner entry than the breakout itself.
Breakouts vs Fakeouts
Not every break of a level is real. A fakeout happens when price pokes through a zone, often with just a wick or one candle, and then falls back inside. Fakeouts are common in crypto, especially around obvious levels where many stop losses sit.
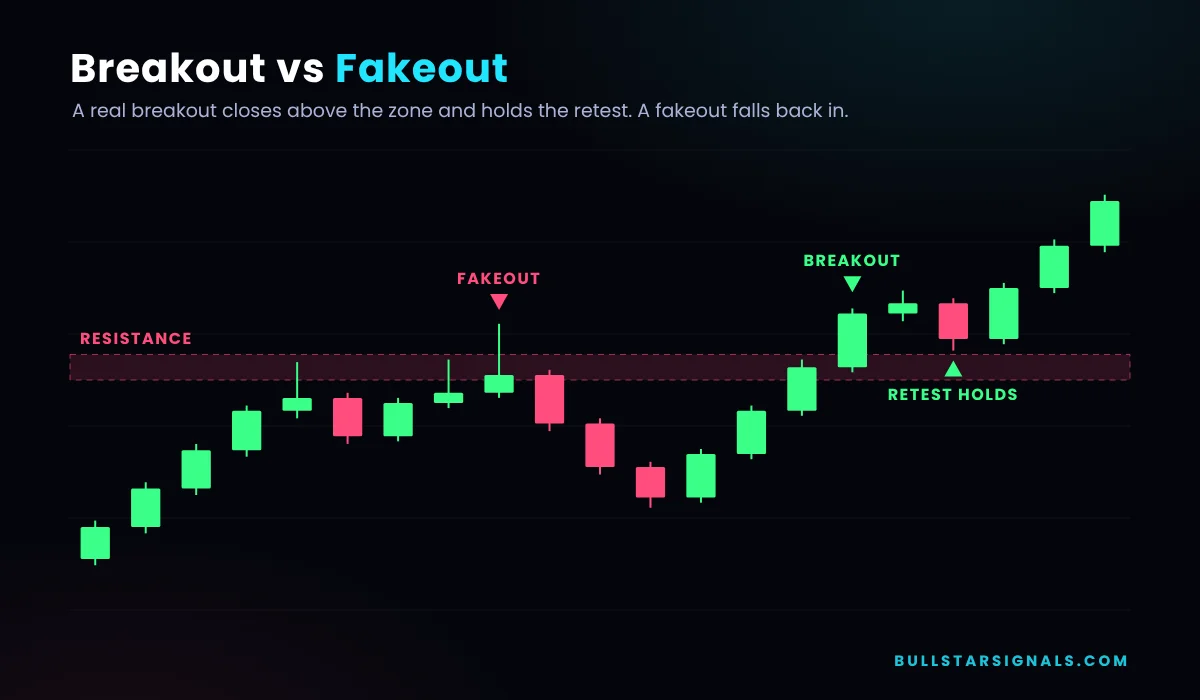
To filter out more fakeouts:
- Wait for a candle close beyond the zone, not just a wick, ideally on the 1-hour chart or higher.
- Watch the retest. A real breakout usually holds when price comes back to the zone.
- Check volume. Breakouts with rising volume tend to be more reliable than quiet ones.
We cover more examples in the fakeouts section of our chart patterns guide.
How to Trade Support and Resistance
There are two main ways to trade these levels.
1. The bounce trade
You buy near support (or short near resistance) and expect price to turn. This works best in a range or when the bigger trend is in your favor. Wait for a sign that buyers are stepping in, like a long lower wick or a strong green candle, instead of buying blindly as price falls.
2. The breakout and retest trade
You wait for price to break a level, then enter on the retest when the old resistance holds as support. You may miss some moves, but you avoid many fakeouts.
Putting it into a trade plan
Whichever method you use, the plan is the same: entry at the zone, stop loss beyond it, targets at the next zones.
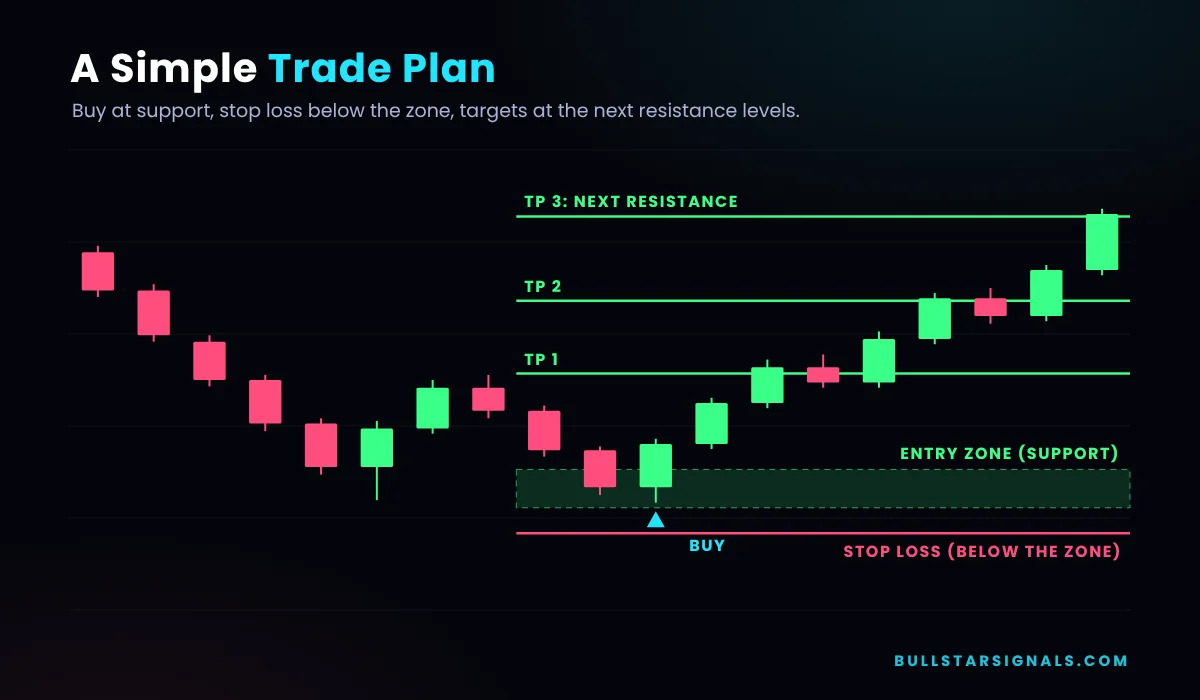
Here's an example with simple numbers. A coin is trading near a support zone between $9.80 and $10.10.
| Price | Distance from entry | |
|---|---|---|
| Entry (inside the support zone) | $10.00 | - |
| Stop loss (below the zone) | $9.40 | -6.0% |
| TP 1 (first resistance) | $10.80 | +8.0% |
| TP 2 (second resistance) | $11.50 | +15.0% |
| TP 3 (major resistance) | $12.40 | +24.0% |
The risk is 6% and the reward to TP 2 is 15%, a risk/reward of 1 : 2.5. With that ratio, you only need to win about 29% of trades to break even. If you trade with leverage, the percentages are multiplied, so size your position by the stop loss distance, not by the leverage. Our leverage guide explains why.
Free Risk/Reward Checker
Enter your entry at support, your stop loss below the zone and your target at the next resistance. The checker shows the risk/reward ratio, the position size for your risk, and the win rate you need to break even.
For a more detailed calculation, including leverage, use our position size calculator.
Common Support and Resistance Mistakes
- Drawing a single thin line. Price rarely turns at an exact price. Use a zone that covers the wicks and the bodies.
- Putting the stop loss exactly on the level. That is where everyone else puts theirs, and wicks often sweep just past it. Place it a little below support or above resistance.
- Buying a breakout on the first candle. Many breakouts fail. Waiting for a close beyond the zone, or a retest, filters out a lot of fakeouts.
- Drawing too many levels. If your chart has 15 lines, every price is near one. Keep the 2 to 4 most obvious zones on the higher time frame.
- Ignoring the trend. Support in a strong downtrend breaks more often. Buying support works best when the bigger trend is up or sideways.
- Forgetting risk/reward. A great support level is still a bad trade if the next resistance is right above it.
The most obvious place for a stop loss is just below support, which is exactly why price often wicks there before turning. Give your stop a little room beyond the zone, and make the position smaller to keep the risk the same. Read more in the stop loss secret.
How Crypto Signals Use Support and Resistance
If you follow trading signals, you're already using support and resistance, even if the signal doesn't say so. The entry zone is usually a support area for a long (or resistance for a short). The take-profit targets sit at the next resistance levels. And the stop loss goes just beyond the zone where the idea is proven wrong.
That's how we build every Bullstar Signals call: an entry zone, several targets and a stop loss on every trade. Knowing support and resistance helps you understand why each level is there, and judge whether a setup makes sense before you take it. Our guide to reading a trading signal walks through each part.
Follow our free Telegram channel and look at how each signal's entry zone, targets and stop loss line up with support and resistance on the chart. Every closed VIP signal, stop losses included, is listed on our results page. Signals are trade ideas for education, not financial advice.
Join Bullstar Signals free channelFrequently Asked Questions
What is support and resistance in crypto trading?
Support is a price zone where buying pressure tends to stop a fall, and resistance is a price zone where selling pressure tends to stop a rise. Traders use these zones to plan entries, stop losses and take-profit targets.
How do you find support and resistance levels?
Start on a higher time frame like the 4-hour or daily chart. Mark the areas where price turned at least twice, using the wicks and bodies to draw a zone rather than a single line. Round numbers and previous highs and lows are good places to look.
What happens when support breaks?
When price closes clearly below a support zone, that zone often becomes resistance. Traders call this role reversal. Price frequently comes back to retest the broken level from below before continuing lower.
Where should I put my stop loss with support and resistance?
For a long trade, place the stop loss a little below the support zone, not exactly on it, so a normal wick does not stop you out. For a short trade, place it a little above resistance. Then size the position so the stop costs only 1 to 2 percent of your account.
What is the difference between a breakout and a fakeout?
A breakout is when price closes beyond a support or resistance zone and stays there, often after a successful retest. A fakeout is when price pokes through the zone with a wick or a single candle and then falls back inside it.
Which time frame is best for support and resistance?
Levels on higher time frames, such as the daily and 4-hour charts, are usually stronger and more reliable. Many traders mark the main zones on the daily chart and then use the 1-hour or 15-minute chart to time the entry.
Does support and resistance work in crypto?
Yes. Crypto is traded by millions of people watching the same charts, so obvious levels often attract orders. They are not guaranteed to hold, which is why every trade still needs a stop loss.
Final Thoughts
Support and resistance are simple, but they're the backbone of almost every trading strategy. Draw zones instead of lines, focus on the higher time frames, respect role reversal, and wait for confirmation before trusting a breakout. Most of all, let these levels decide where your stop loss and targets go, so every trade has a clear plan before you enter.
Want to go further? Learn the patterns that form around these levels in our chart patterns guide, and pick the right hours to trade them with our guide to the best time to trade crypto.
Disclaimer: This guide is for education only and is not financial advice. Support and resistance levels can fail at any time. Crypto trading, especially with leverage, carries a high risk of loss.