 BULLSTAR
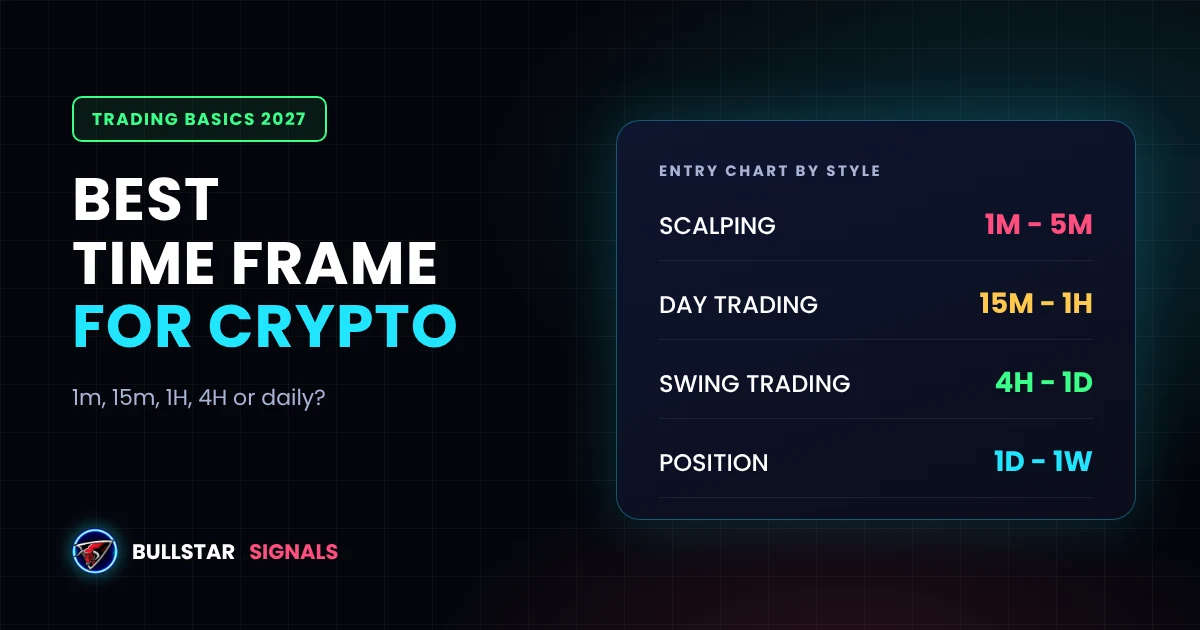
Open any crypto chart and the first choice you face is the time frame: 1 minute, 15 minutes, 1 hour, 4 hours, 1 day. Pick the wrong one and you either drown in noise or sit through moves you could have traded. Pick the right one and the same chart suddenly makes sense.
There is no single best time frame for everyone. The right one depends on how much time you have, how fast you want trades to play out, and how much noise you can handle. This guide shows which time frames fit each trading style, how to combine them, and how to choose yours. There is a quick time frame finder below.
- Scalping: 1m to 5m charts, with the 15m for direction.
- Day trading: 15m to 1H charts, with the 4H for direction.
- Swing trading: 4H to daily charts, with the daily or weekly for direction.
- Beginners: start with the 4H chart. It has much less noise and gives you time to think.
What Is a Time Frame in Crypto Trading?
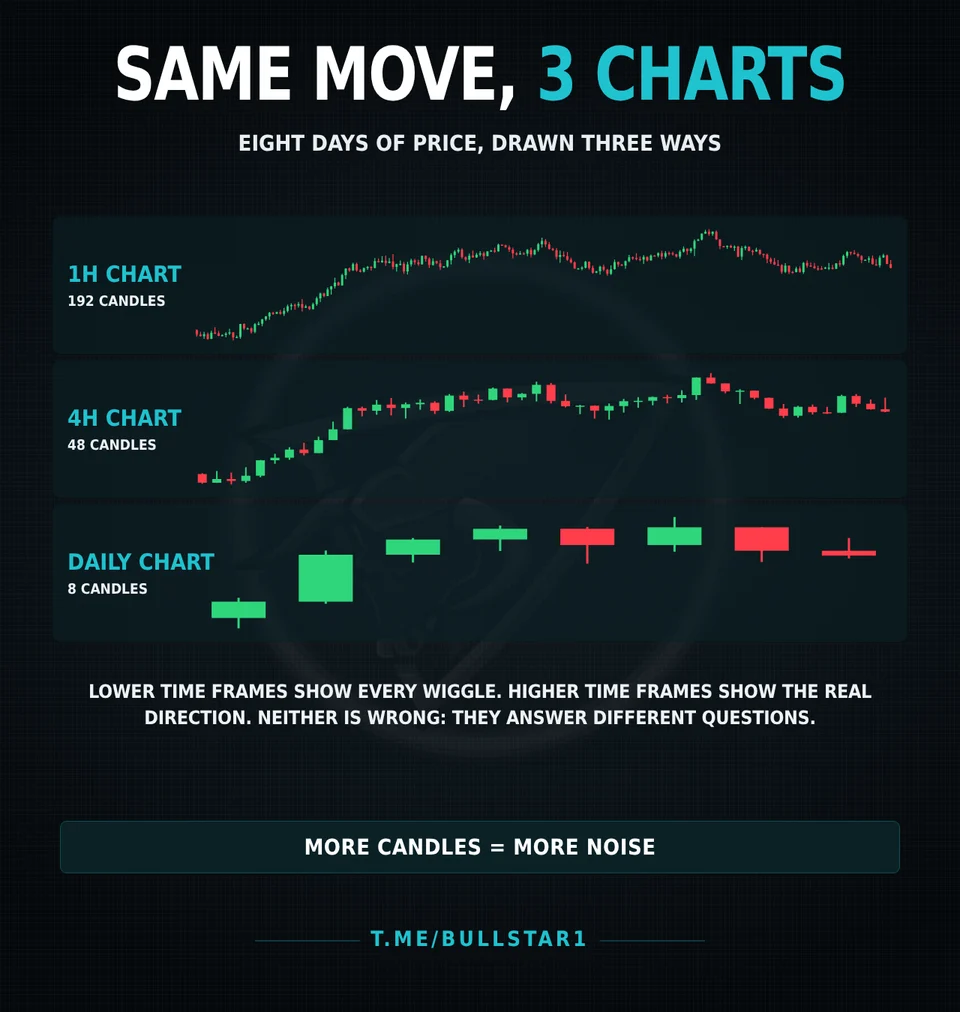
A time frame is how much time each candle on the chart covers. On a 1-hour chart, every candle shows one hour of price: where it opened, the high, the low and where it closed. On a daily chart, each candle is a full day.
The price is the same. Only the view changes. A 1H chart of eight days has 192 candles and shows every small swing. A daily chart of the same eight days has just 8 candles and shows the bigger direction. Lower time frames give you more detail and more trades. Higher time frames give you less noise and more reliable levels.
Crypto trades 24/7, so every time frame keeps moving day and night. That is different from stocks, and it is why the time of day matters too. Our guide on the best time to trade crypto shows which hours bring the most volume.
Best Time Frame for Each Trading Style
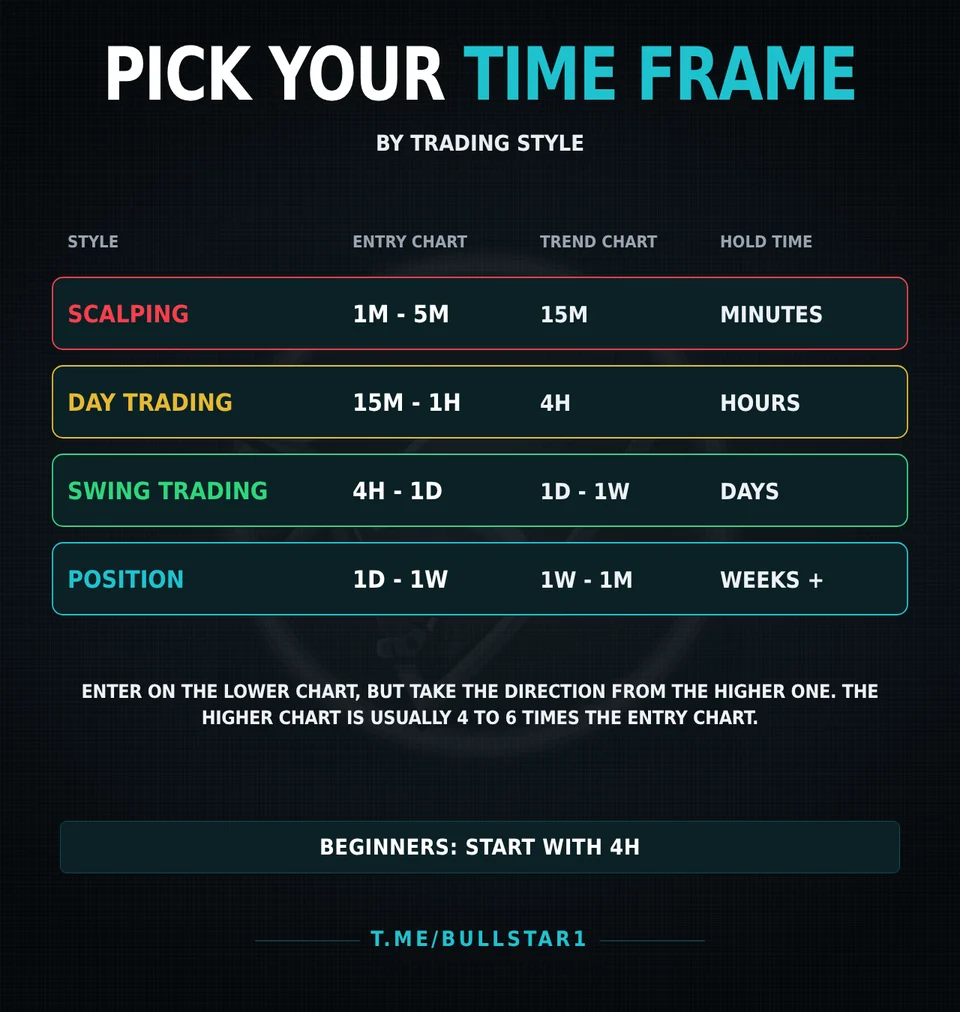
| Style | Entry chart | Trend chart | Hold time |
|---|---|---|---|
| Scalping | 1m - 5m | 15m | Minutes |
| Day trading | 15m - 1H | 4H | Hours |
| Swing trading | 4H - 1D | 1D - 1W | Days to weeks |
| Position trading | 1D - 1W | 1W - 1M | Weeks to months |
Scalping: 1m to 5m
Scalpers open and close trades within minutes, aiming for small moves many times a day. The 1m and 5m charts show every tick, which is exactly what they need, but also every fake move. Scalping needs fast decisions, low fees and full attention. It is the hardest style for beginners because fees, spread and random wicks take a big share of each small win.
Day trading: 15m to 1H
Day traders open and close trades within the same day. The 15m and 1H charts give enough detail to time entries, while the 4H chart shows the direction of the day. This style suits people who can check the chart several times a day, especially around the busiest hours.
Swing trading: 4H to daily
Swing traders hold trades for a few days to a couple of weeks, trying to catch one clear move. The 4H and daily charts filter out most of the noise, levels like support and resistance hold better, and you only need to check the chart a few times a day. For most people with a job, this is the most realistic style.
Position trading: daily to weekly
Position traders follow the big trend for weeks or months. They mostly use the daily and weekly charts and trade rarely. With leverage, long holds also mean paying funding fees for longer, so many position traders use spot instead.
Find Your Time Frame
Answer three questions to see which charts fit you.
Use More Than One Time Frame: Top-Down Analysis
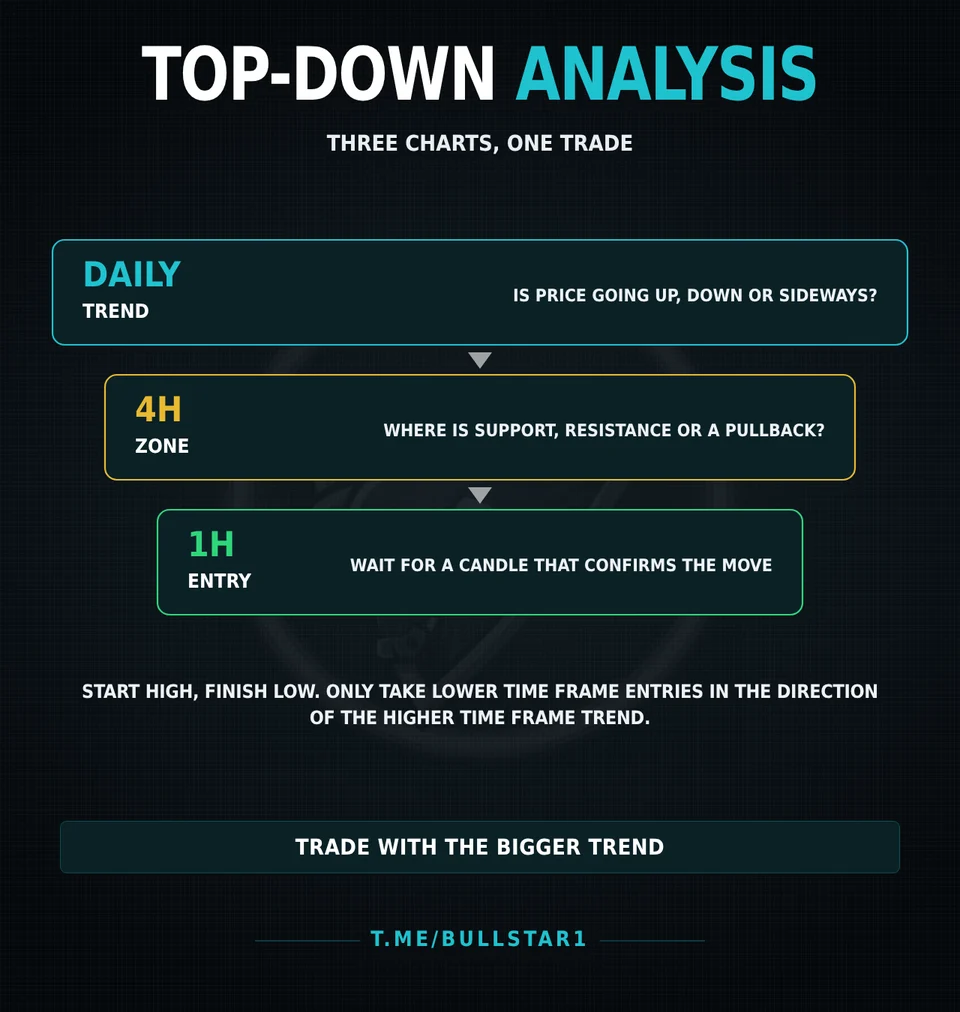
The best traders rarely use just one chart. They start high and finish low:
- Higher time frame, the trend. On the daily chart, decide if the market is going up, down or sideways.
- Middle time frame, the zone. On the 4H chart, find where price is likely to react: a support level, a pullback or a Fibonacci zone.
- Lower time frame, the entry. On the 1H chart, wait for a candle or pattern that confirms the move before you enter.
A simple rule keeps the three charts in step: each one is about 4 to 6 times the one below it. Daily, 4H, 1H. Or 4H, 1H, 15m. And the most important part: only take lower time frame entries in the direction of the higher time frame trend. A perfect buy setup on the 15m chart means little if the daily chart is falling hard.
Time Frames and Your Stop Loss
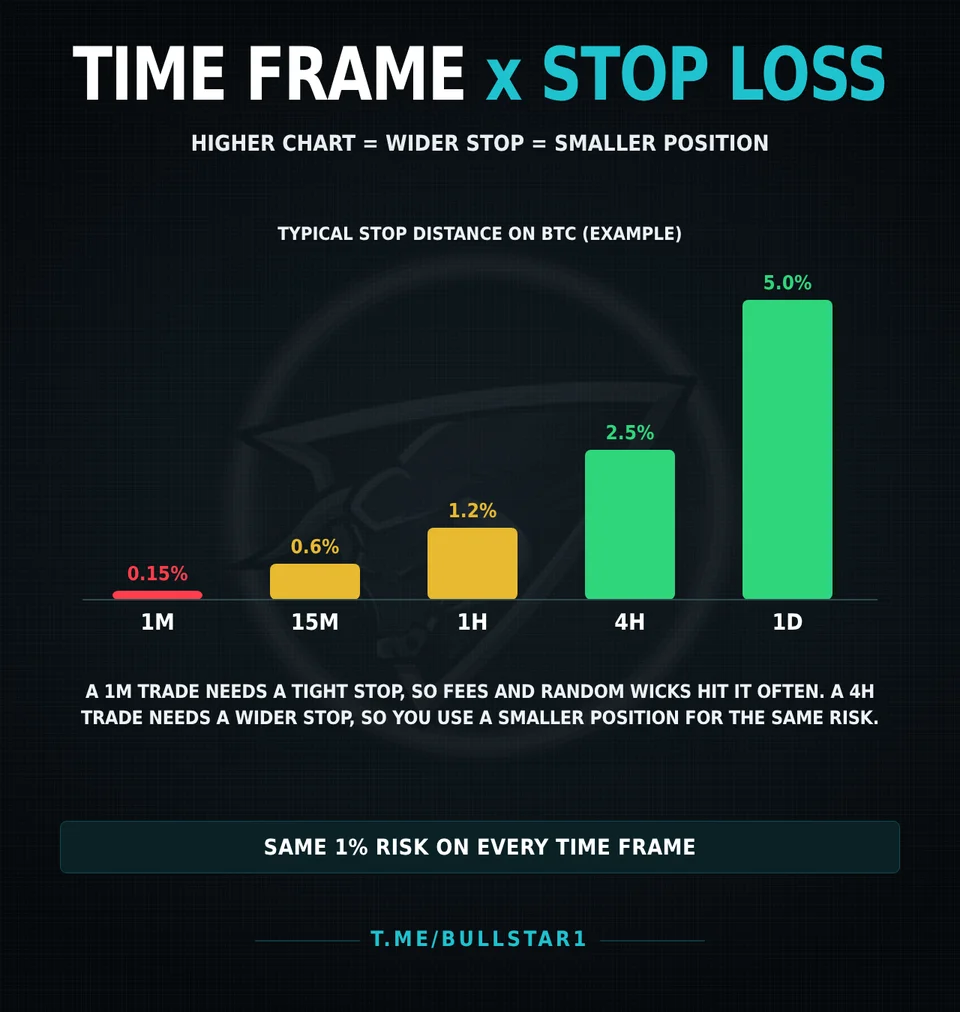
Your time frame decides how far away your stop loss has to be. On a 1m chart, a normal stop on Bitcoin might be a fraction of a percent away. On a daily chart, it can be several percent. The numbers above are only an example, but the pattern is always the same: the higher the chart, the wider the stop.
That doesn't make higher time frames riskier. You simply use a smaller position so that hitting the stop still costs the same 1-2% of your account. Our position size calculator does this for you, and our guide on where to put your stop loss shows how to place it on any chart.
Very low time frames have a hidden cost: with tight stops, trading fees and spread eat a much bigger share of each trade, and a single random wick can stop you out. That is one more reason beginners do better on higher charts.
Common Time Frame Mistakes
- Jumping between charts until one agrees with you. Pick your time frames before you look for a trade, and stick to them.
- Trading the 1m chart without a plan. Lower charts feel exciting but produce the most false signals.
- Ignoring the higher time frame. Fighting the daily trend is the fastest way to collect stop losses.
- Using the same stop distance on every chart. A stop that works on the 4H chart is far too wide for a 5m trade, and a 5m stop is far too tight for a swing trade.
- Using high leverage on long holds. The longer the trade, the more room price needs and the more funding you pay. See leverage explained.
What Time Frame Do Signals Use?
Most futures signals, including ours, are planned on higher time frames and then timed on lower ones. The entry zone, targets and stop loss are set from the bigger structure, so you don't need to watch a 1m chart to follow them. Many of our VIP signals play out over a few hours to a few days, which fits day and swing traders who check the chart a few times a day.
You can see how every VIP signal since 2022 played out on our results page, or follow the free Telegram channel to see the timing for yourself.
Not financial advice. Crypto trading, especially with leverage, carries high risk.