 BULLSTAR
Fibonacci retracement is one of the most popular tools in crypto trading, and for a simple reason: so many traders watch the same levels that price often reacts there. Used well, it helps you find better entries on pullbacks and clear targets for your profits. Used badly, it becomes a set of random lines you can fit to any chart.
This guide explains what the Fibonacci levels mean, how to draw them correctly in an uptrend and a downtrend, how to use extensions for take-profit targets, and the mistakes that make most traders give up on the tool. It also includes a free Fibonacci calculator.
- What it is: levels at 23.6%, 38.2%, 50%, 61.8% and 78.6% of a price move.
- How to draw it: swing low to swing high in an uptrend, swing high to swing low in a downtrend.
- The key area: the 50% - 61.8% "golden zone", where pullbacks often stop.
- Best use: combined with support and resistance, never on its own.
What Is Fibonacci Retracement?
The Fibonacci sequence is a series of numbers where each number is the sum of the two before it: 0, 1, 1, 2, 3, 5, 8, 13, 21 and so on. Dividing numbers in the sequence gives ratios like 0.618, 0.382 and 0.236, which traders turn into percentages.
A Fibonacci retracement tool draws horizontal lines at those percentages of a price move. After a strong move up, the levels show how much of that move a pullback has given back. Here is what each level usually tells you:
The 50% level is not a real Fibonacci ratio, but it is included in almost every charting tool because price often reacts halfway through a move.
The Golden Zone: Where Pullbacks Often Stop
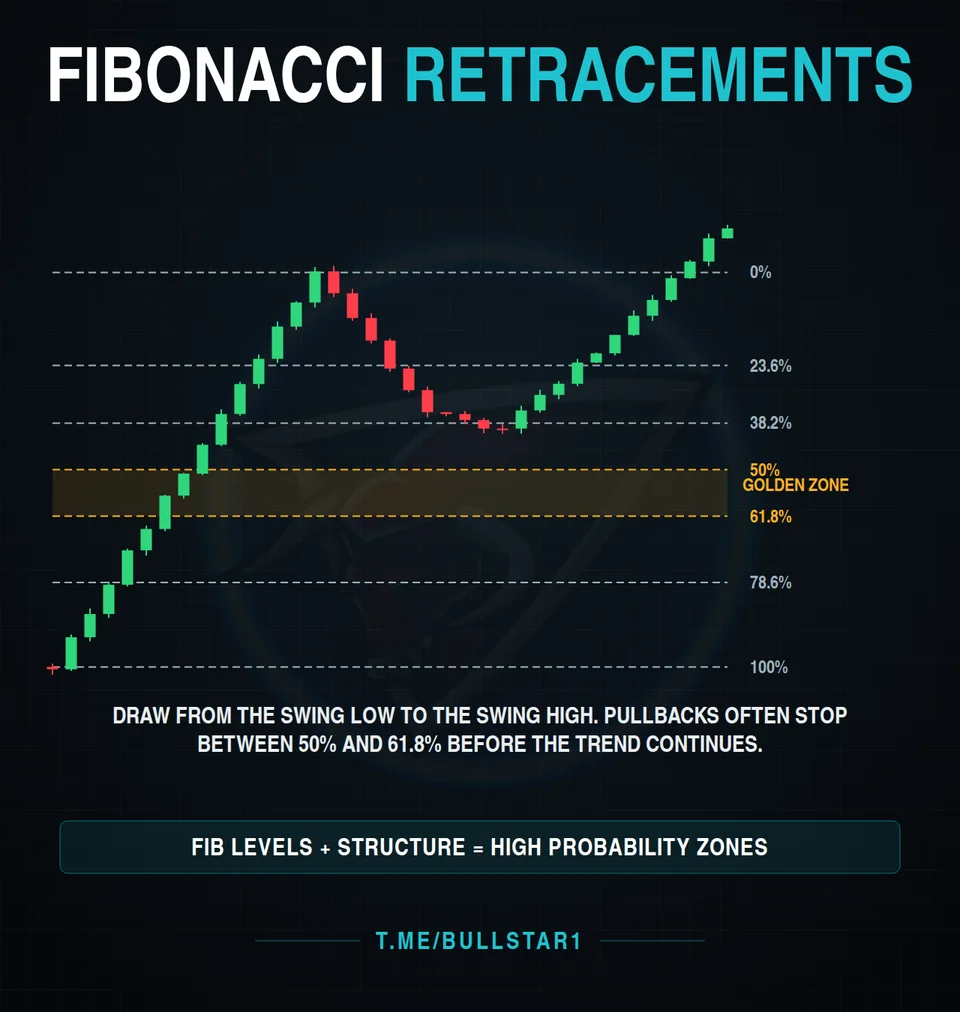
Draw the tool from the swing low to the swing high. In a healthy uptrend, pullbacks often stop between the 50% and 61.8% levels before the trend continues. That area is called the golden zone.
The golden zone is not a magic buy button. It is an area to watch. What you want to see there is a sign that buyers are stepping back in: a bullish engulfing candle, a hammer, or a higher low on a lower time frame. Our chart patterns cheat sheet covers the candles worth knowing.
How to Draw Fibonacci Retracement Correctly
- Find a clear trend. Fibonacci works best after an obvious move, not in a sideways range.
- Pick the right swing points. In an uptrend, click the swing low first and drag to the swing high. In a downtrend, start at the swing high and drag to the swing low.
- Use obvious swings. If you have to search for the swing point, it is probably the wrong one. The 4 hour and daily charts give the cleanest swings.
- Be consistent. Use the wicks or the candle bodies, but always the same way.
- Don't move the lines after price reacts. If the levels only work after you adjust them, they are not telling you anything.
On TradingView, the tool is called "Fib Retracement". Select it from the left toolbar or press Alt + F, then click the two swing points.
Fibonacci + Structure = Strong Entries
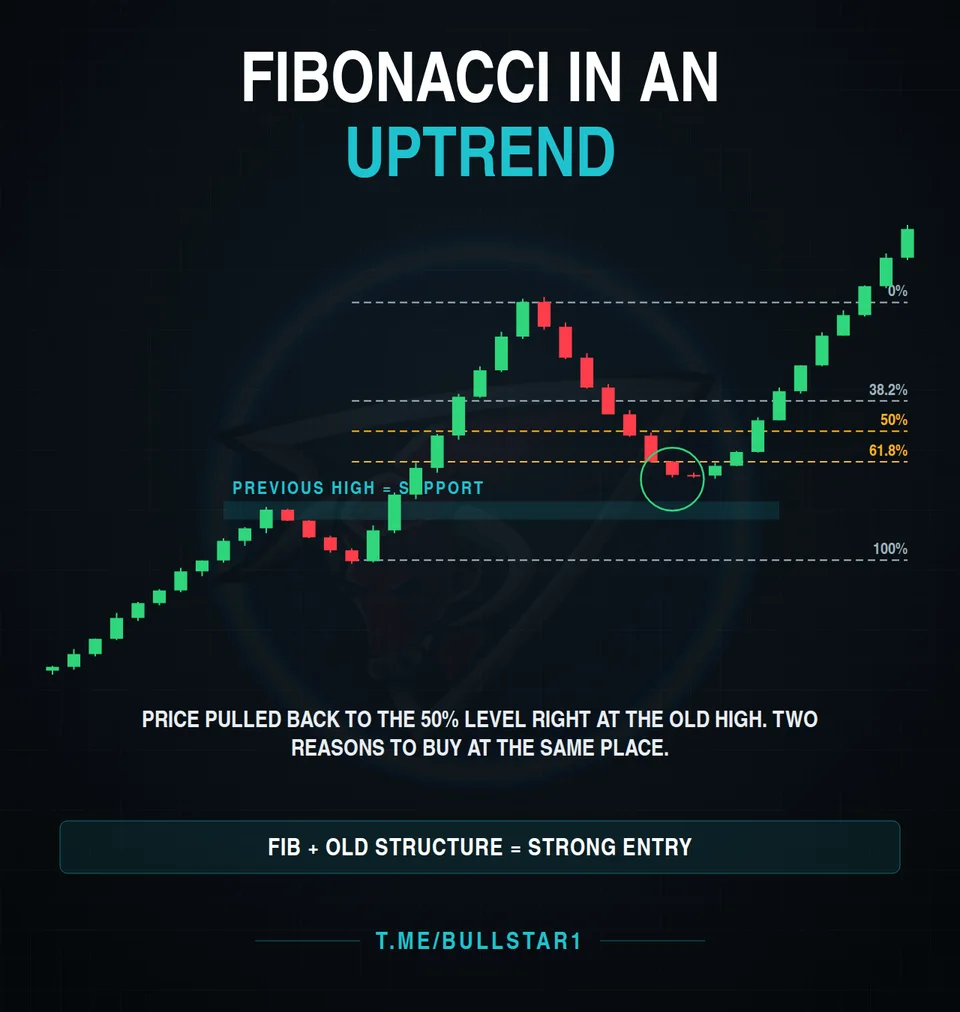
A Fibonacci level on its own is a weak reason to trade. It becomes powerful when it lines up with something else. In the example above, price pulled back to the 50% level right at an old high that had turned into support. Two independent reasons pointed to the same price, and the trend continued from there.
Look for Fibonacci levels that line up with:
- A previous high or low (old resistance becoming support, or the other way around)
- A trendline or channel line
- A demand or supply zone
- A round number, like $60,000 on Bitcoin
Our support and resistance guide shows how to find the levels that matter most.
Fibonacci in a Downtrend
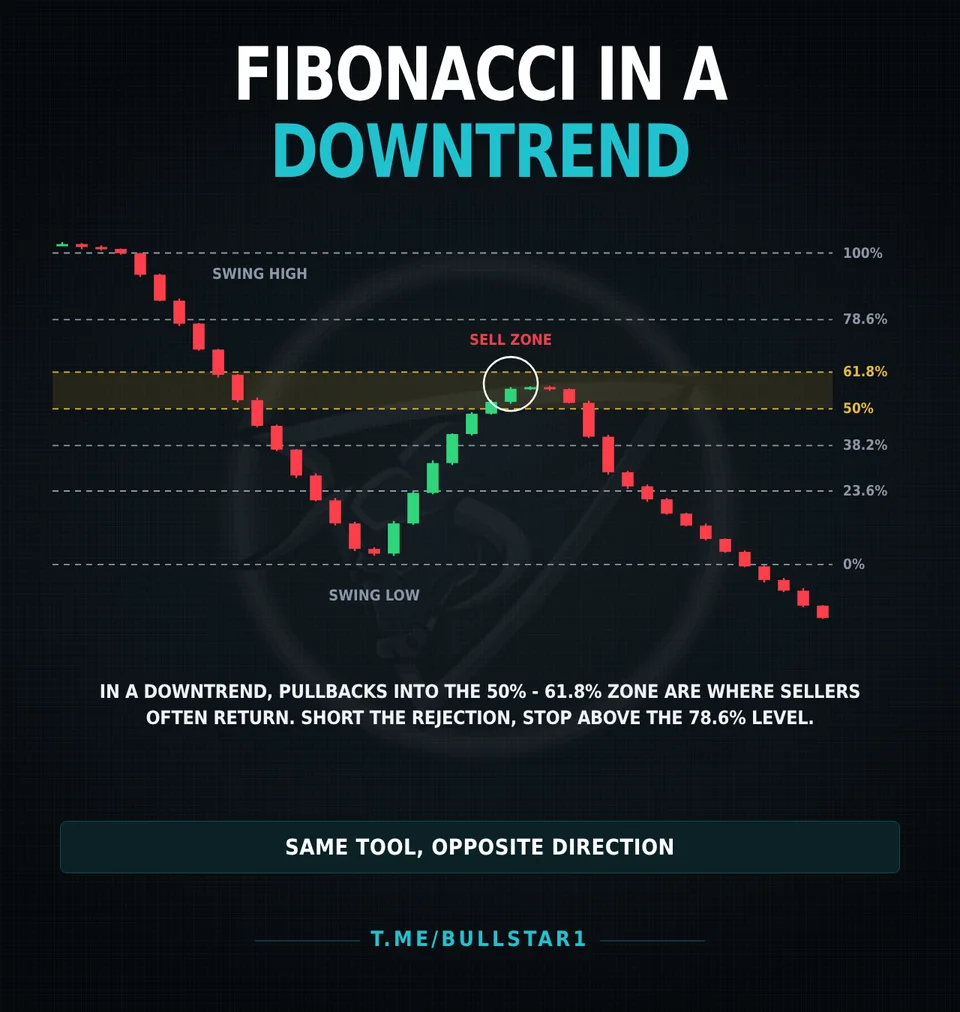
The tool works the same way in a downtrend, just in reverse. Draw from the swing high to the swing low. When price bounces, the 50% to 61.8% zone is where sellers often return. Many traders look to short when price rejects that zone, with the stop loss above the 78.6% level.
Fibonacci Extensions: Where to Take Profit
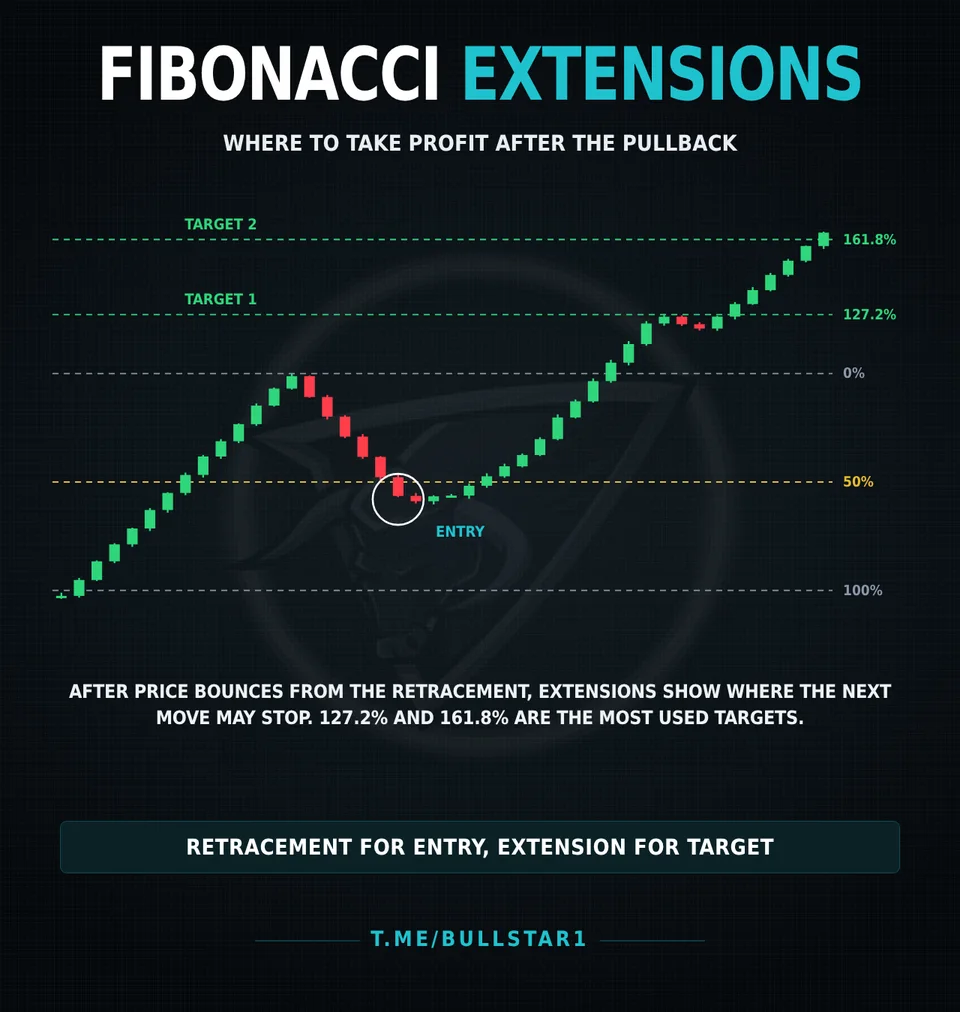
Retracements help with entries. Extensions help with exits. After price bounces from the retracement and breaks the previous high, the 127.2% and 161.8% extension levels show where the next move may run out of steam. Many traders take partial profit at the first and let the rest run to the second.
Example: A Fibonacci Trade Step by Step
Here is a simple example with round numbers. Say Bitcoin rises from a swing low of $60,000 to a swing high of $70,000, then starts to pull back. Drawing Fibonacci from $60,000 to $70,000 gives these levels:
- Entry: in the $63,820 - $65,000 golden zone, ideally after a bullish candle closes there.
- Stop loss: below the 78.6% level, around $62,000, or below $60,000 for a wider swing trade.
- Targets: the previous high at $70,000 first, then the extensions at $72,720 and $76,180.
With an entry at $64,500 and a stop at $62,000, you risk $2,500 per Bitcoin to make $5,500 to the previous high, a risk-to-reward ratio of about 1:2.2. Size the position so that $2,500 per Bitcoin equals only 1-2% of your account. Our position size calculator does the math for you.
Free Fibonacci Calculator
Enter any swing low and swing high to get the retracement and extension levels instantly.
Gold rows are the 50% - 61.8% zone. Green rows are extension targets.
Common Fibonacci Mistakes
- Drawing on random swings. Small, unclear swings give meaningless levels.
- Buying every level. Price touches a level and keeps going all the time. Wait for a reaction.
- Using Fibonacci alone. Without structure, volume or a candle signal, it is just a guess.
- Ignoring the higher time frame. A perfect 61.8% bounce on the 15 minute chart means little against a daily downtrend.
- Skipping the stop loss. Every Fibonacci level can fail. Know where the setup is wrong before you enter.
In our free Telegram channel we post futures signals with the entry zone, targets and stop loss already worked out, and we publish every result, losses included.
Join Bullstar Signals free channelFrequently Asked Questions
What is Fibonacci retracement in crypto?
Fibonacci retracement is a tool that draws horizontal levels between a swing low and a swing high, at 23.6%, 38.2%, 50%, 61.8% and 78.6% of the move. Traders use those levels to estimate where a pullback might stop before the trend continues.
What is the golden zone in Fibonacci?
The golden zone is the area between the 50% and 61.8% retracement levels. Many traders watch it because pullbacks in a healthy trend often stop there, especially when it lines up with old support or resistance.
How do you draw Fibonacci retracement correctly?
In an uptrend, draw from the swing low to the swing high. In a downtrend, draw from the swing high to the swing low. Use clear, obvious swing points, ideally on the 4 hour or daily chart, and use candle wicks or bodies consistently.
Which Fibonacci level is the most reliable?
No level works every time. The 61.8% level and the 50% to 61.8% zone are the most widely watched, so they often get a reaction. A level is much stronger when it lines up with support, resistance or a trendline.
What are Fibonacci extensions used for?
Fibonacci extensions, such as 127.2% and 161.8%, project levels beyond the previous high or low. Traders use them as take-profit targets after entering on a retracement.
Does Fibonacci work in crypto?
Fibonacci levels work in crypto because so many traders watch them, which makes reactions at those levels more likely. They are not predictions, so always combine them with market structure and use a stop loss.
What time frame is best for Fibonacci retracement?
Fibonacci levels drawn on the 4 hour, daily and weekly charts are usually more reliable than on very low time frames. Many traders draw the levels on a higher time frame and look for an entry on a lower one.
Where should I put my stop loss with Fibonacci?
A common approach is to place the stop loss just beyond the 78.6% level or beyond the swing point you drew from. If price closes past those levels, the setup is no longer valid.
Final Thoughts
Fibonacci retracement doesn't predict where price will go. It shows where a lot of traders are watching, which is why reactions there are more likely. Draw it from clear swings, focus on the 50% - 61.8% zone, look for confluence with support and resistance, and use extensions for your targets. Most of all, set your stop loss before you enter and size the trade so one loss doesn't hurt.
This article is for educational purposes only and is not financial advice. The trade example uses round numbers for illustration. Crypto trading carries high risk.