 BULLSTAR
Open almost any crypto chart and you will see one or two smooth lines following the price. Those are moving averages, and they are one of the oldest and most useful tools in trading. They don't predict the future, but they show you the trend at a glance, where price may find support, and when momentum is changing.
This guide explains how moving averages work, the difference between EMA and SMA, the 20, 50 and 200 that most traders watch, the golden cross and death cross, and simple ways to trade with them. There is a free moving average calculator below too.
- What it is: a moving average is the average closing price over the last X candles, drawn as a line that moves with the chart.
- EMA vs SMA: the EMA reacts faster because it gives more weight to recent candles. The SMA is smoother and slower.
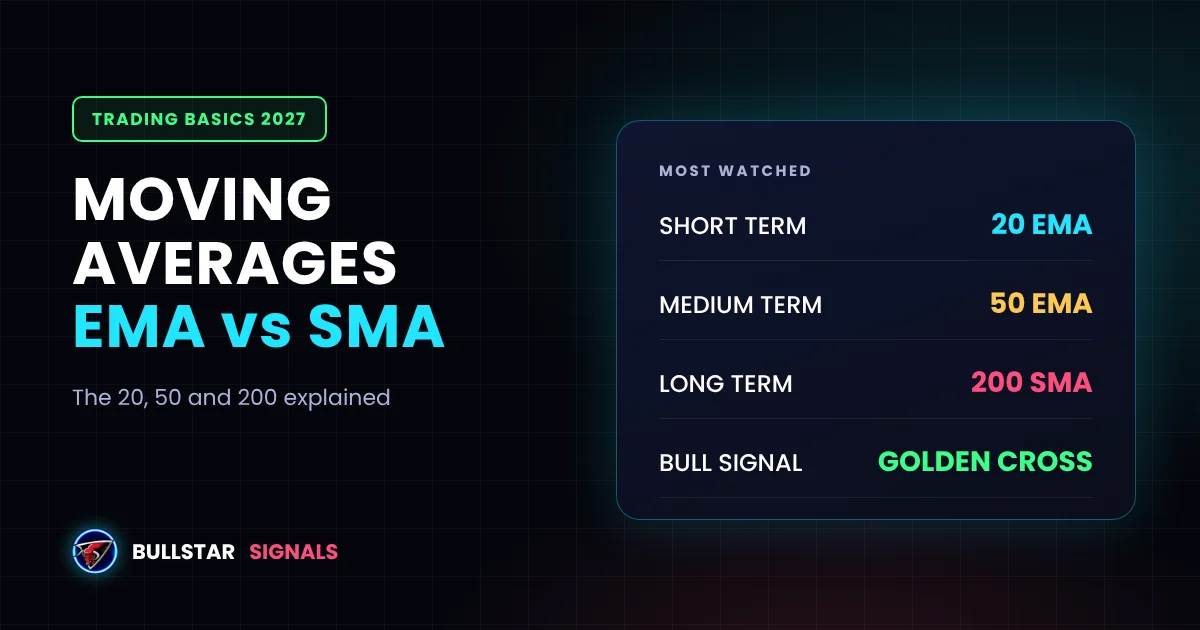
- Most watched: the 20 EMA for short-term trend, the 50 for medium term and the 200 for the long-term trend.
- Main rule: price above a rising moving average = uptrend. Price below a falling one = downtrend.
What Is a Moving Average?
A moving average takes the closing prices of the last X candles and averages them. On a 4H chart, a 20-period moving average is the average close of the last 20 four-hour candles. Every time a new candle closes, the oldest one drops out and the newest one is added, so the line "moves" with the price.
The result is a smooth line that filters out most of the noise. Instead of reacting to every wick, you see the direction the market is really going.
- Price above a rising moving average: buyers are in control.
- Price below a falling moving average: sellers are in control.
- Price crossing back and forth over a flat moving average: no clear trend, the market is ranging.
EMA vs SMA: What's the Difference?
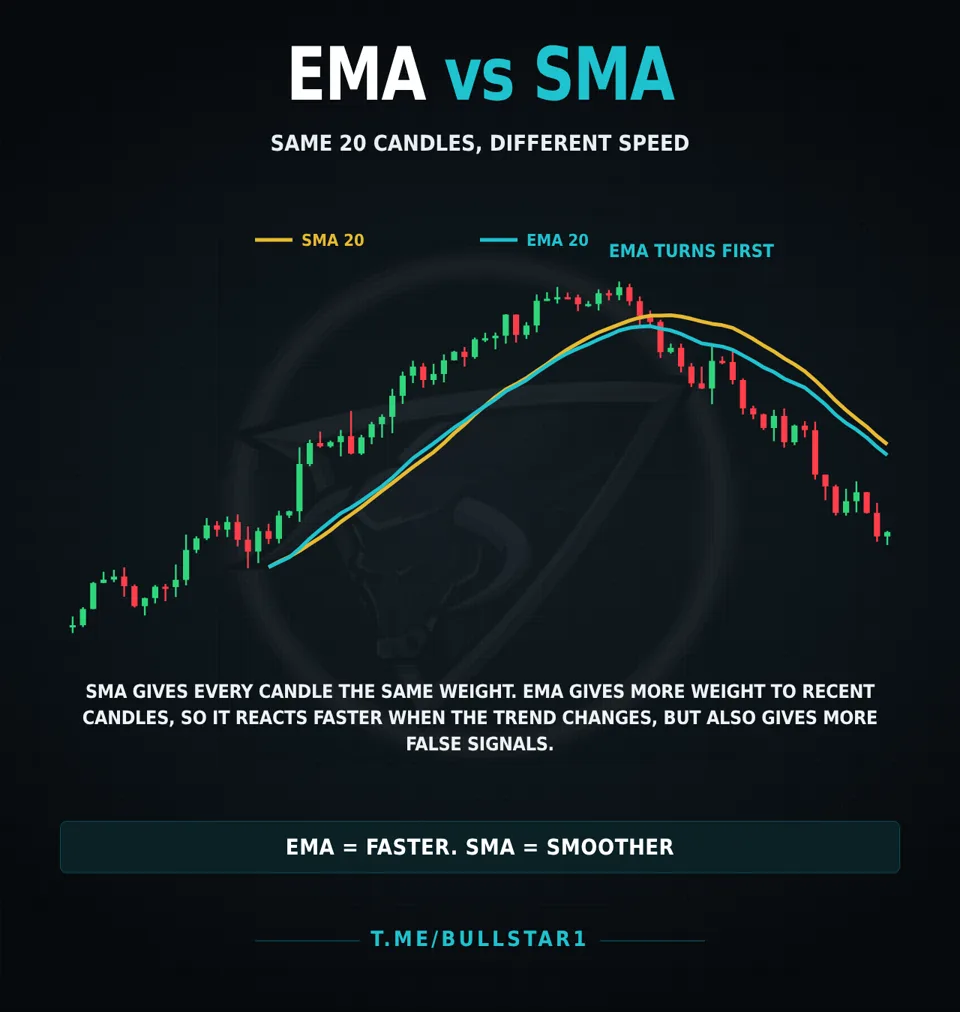
There are two main types of moving average, and the difference is how they weigh each candle.
| SMA (Simple) | EMA (Exponential) | |
|---|---|---|
| Weighting | Every candle counts the same | Recent candles count more |
| Speed | Slower, smoother | Faster, reacts sooner |
| False signals | Fewer | More |
| Best for | Long-term trend (200 SMA) | Entries and short-term trend |
Crypto moves fast, which is why many crypto traders prefer EMAs for timing trades and keep the 200 SMA for the big picture. Neither is better. They answer slightly different questions: the EMA tells you what the market is doing now, the SMA tells you what it has been doing.
The 20, 50 and 200: Moving Averages Everyone Watches
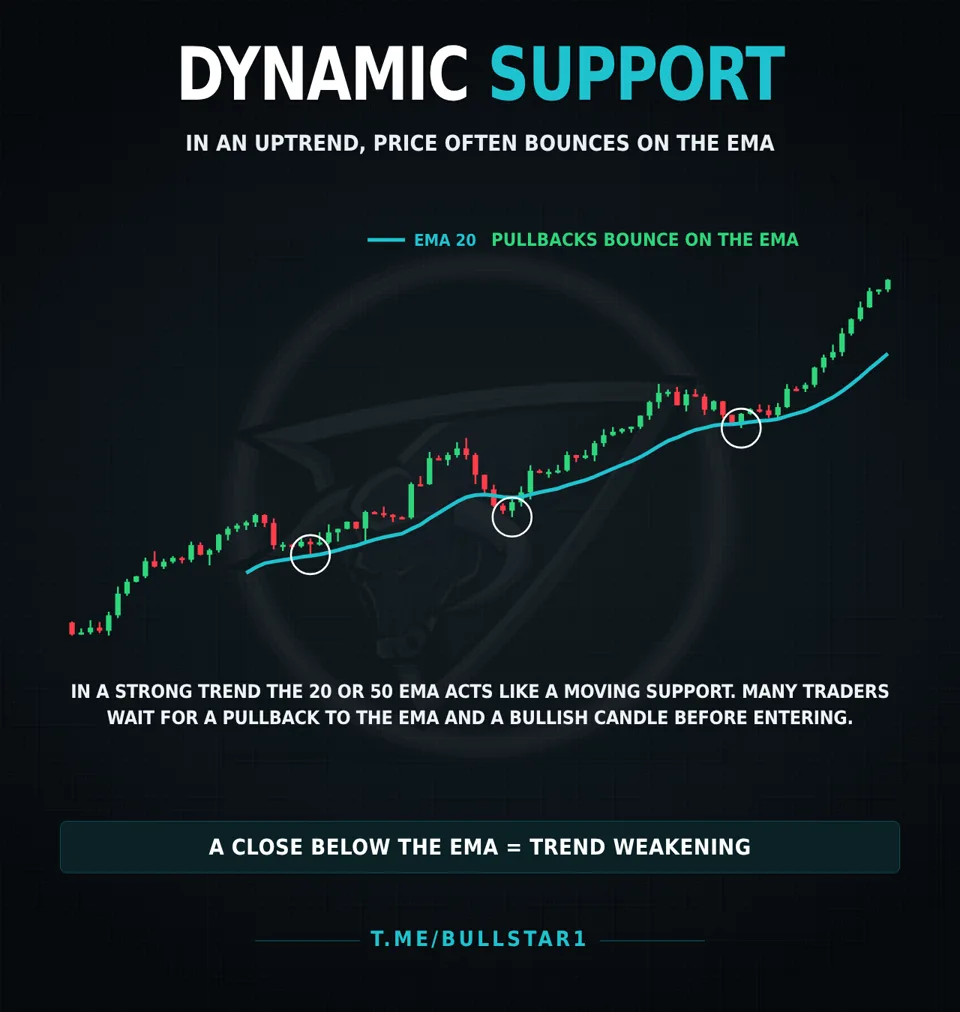
- 20 EMA: the short-term trend. In strong trends, price often pulls back to it and bounces.
- 50 EMA or SMA: the medium-term trend. A common support in healthy uptrends and a common resistance in downtrends.
- 200 SMA: the long-term trend. On the daily chart, many traders treat Bitcoin above the 200-day as a bull market and below it as a bear market.
These numbers have no magic. They matter because so many traders watch them, and that crowd behaviour is what turns them into levels where price often reacts.
Golden Cross and Death Cross
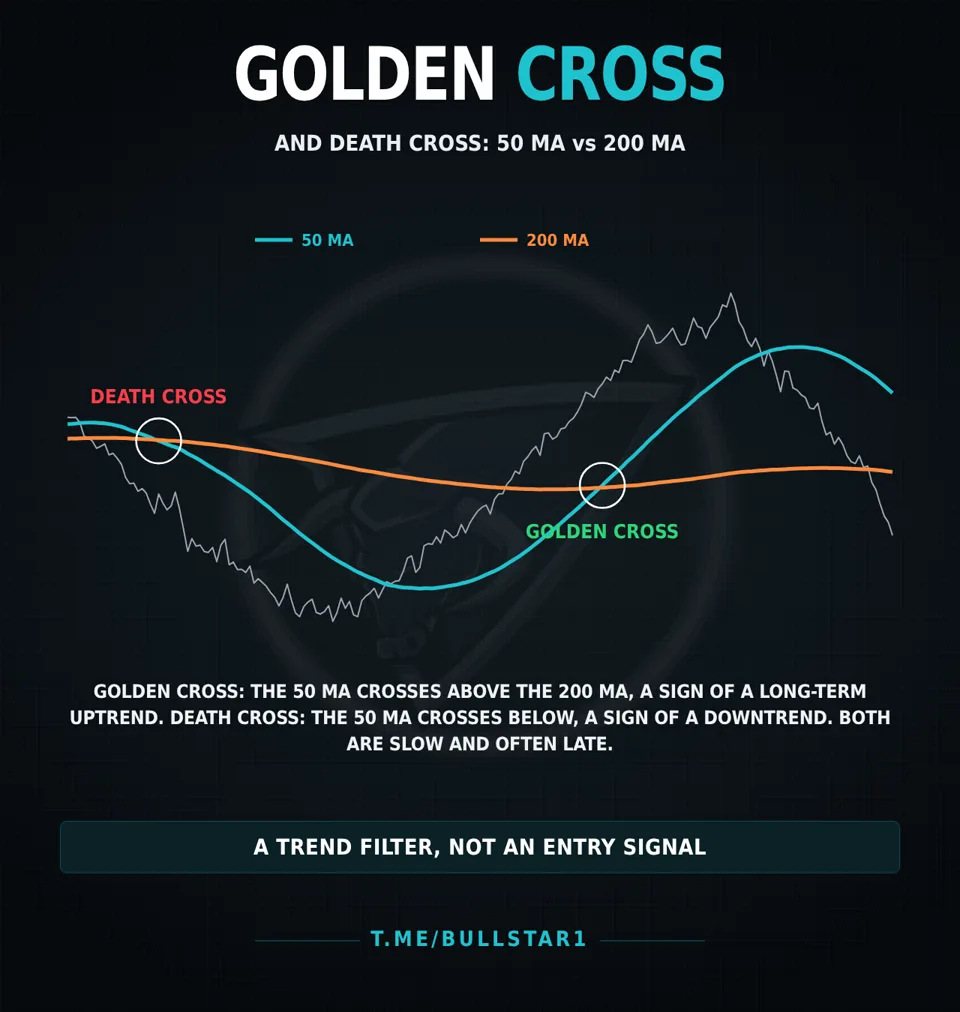
The two most famous moving average signals use the 50 and the 200:
- Golden cross: the 50 MA crosses above the 200 MA. It suggests a long-term uptrend is starting.
- Death cross: the 50 MA crosses below the 200 MA. It suggests a long-term downtrend.
Both make headlines when they happen on the Bitcoin daily chart. The catch is that they are slow. By the time the 50 crosses the 200, price has usually already moved a lot, and in choppy markets the lines can cross back and forth several times. Treat them as a trend filter, a reason to favour longs or shorts, not as an exact entry signal.
Free Moving Average Calculator
Paste closing prices (oldest first) to calculate the SMA and EMA and see where the current price sits compared with them.
How to Trade With Moving Averages
1. Use them to read the trend
Before any trade, check where price is compared with the 50 and 200 on a higher time frame. Above both and both rising: look for longs. Below both and both falling: look for shorts or stay out. This one check keeps you from fighting the trend, the most common reason traders lose.
2. Buy pullbacks to the EMA
In a strong uptrend, price often pulls back to the 20 or 50 EMA and bounces, as if the line were a moving support. Wait for price to reach the EMA, then for a bullish candle that confirms the bounce. Put your stop loss below the EMA or below the recent swing low. Combining this with RSI dropping to the 40-50 area makes the setup stronger.
3. Combine with support and resistance
Moving averages work best when they line up with other levels. A 50 EMA sitting right on a horizontal support level or a Fibonacci zone is a much stronger area than either one alone.
4. EMA crossovers
Short-term traders watch two EMAs, for example the 9 and 21. When the fast one crosses above the slow one, momentum is turning up, and the reverse when it crosses below. Crossovers work well in trends but give many false signals in sideways markets, so only use them when the bigger trend agrees.
Best Moving Average Settings for Crypto
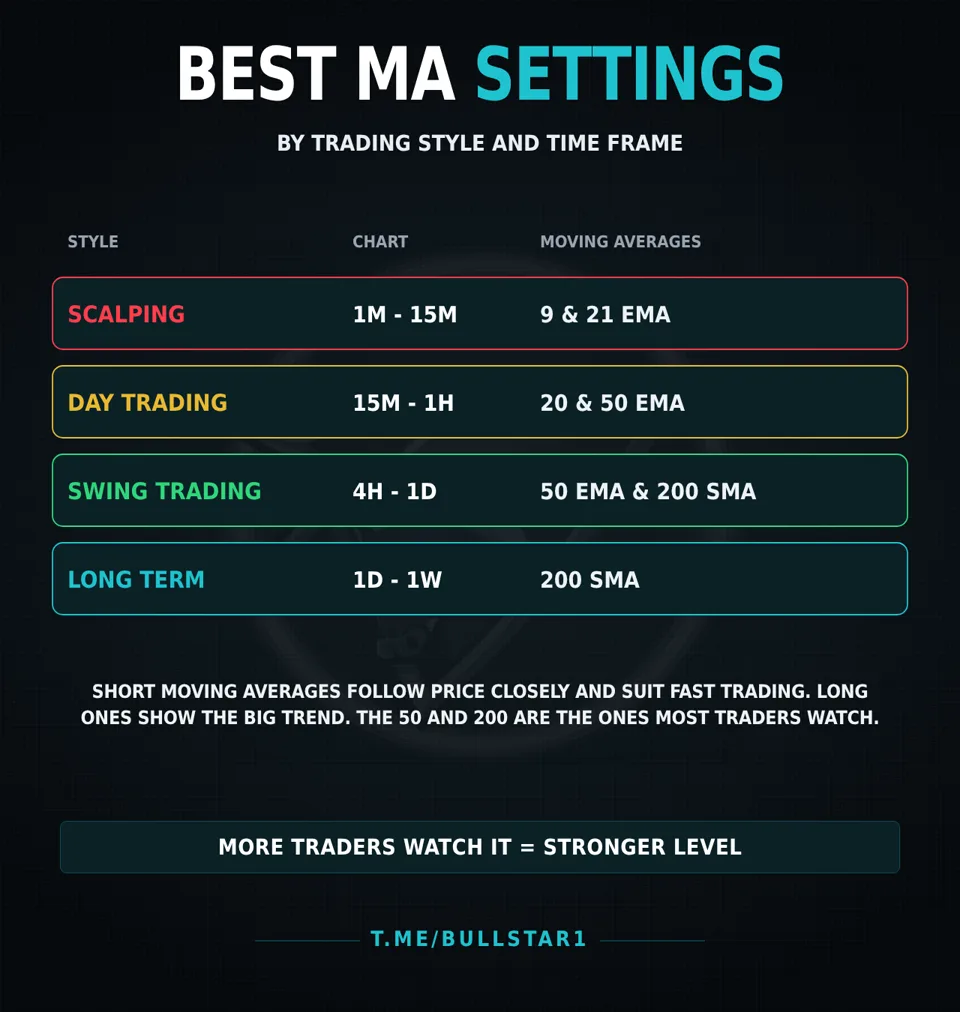
| Style | Chart | Moving averages |
|---|---|---|
| Scalping | 1m - 15m | 9 & 21 EMA |
| Day trading | 15m - 1H | 20 & 50 EMA |
| Swing trading | 4H - 1D | 50 EMA & 200 SMA |
| Long term | 1D - 1W | 200 SMA |
Don't put ten moving averages on your chart. Two or three, matched to your time frame, are enough. More lines just means more conflicting signals.
Common Moving Average Mistakes
- Trading every crossover. In sideways markets moving averages cross constantly and most of those signals fail.
- Expecting an exact bounce. Moving averages are zones, not precise lines. Price often wicks a little through them before bouncing.
- Using them alone. They lag by design. Combine them with structure, volume and chart patterns.
- Ignoring the time frame. A 200 MA on the 5m chart covers less than a day. On the daily chart it covers more than six months.
- No risk plan. Even the cleanest setup fails sometimes. Size every trade with a position size calculator.
Moving Averages and Trading Signals
Moving averages are one of the tools we use when we plan a signal, mainly to check the higher time frame trend before an entry. A long setup against a falling 200 MA needs a much stronger reason than one with the trend. Every Bullstar signal comes with a clear entry zone, take-profit targets and a stop loss.
You can see how every VIP signal since 2022 played out, losses included, on our results page, or follow the free Telegram channel to watch the setups live.
Not financial advice. Crypto trading, especially with leverage, carries high risk.